Results

Job id: Example2_ACC
Sequence: GIVEQCAASVCSL
Status of the job:
finishedJob parameters:
| Name | Value |
|---|---|
| Job name | Example2_ACC |
| Secondary structure | |
| Number of runs | 50 |
| Number of Monte Carlo steps | |
| Disulfide bridges | 6:11 |
| pH | 2.0 |
| Initial temperature | 2.0 |
| Final temperature | 1.0 |
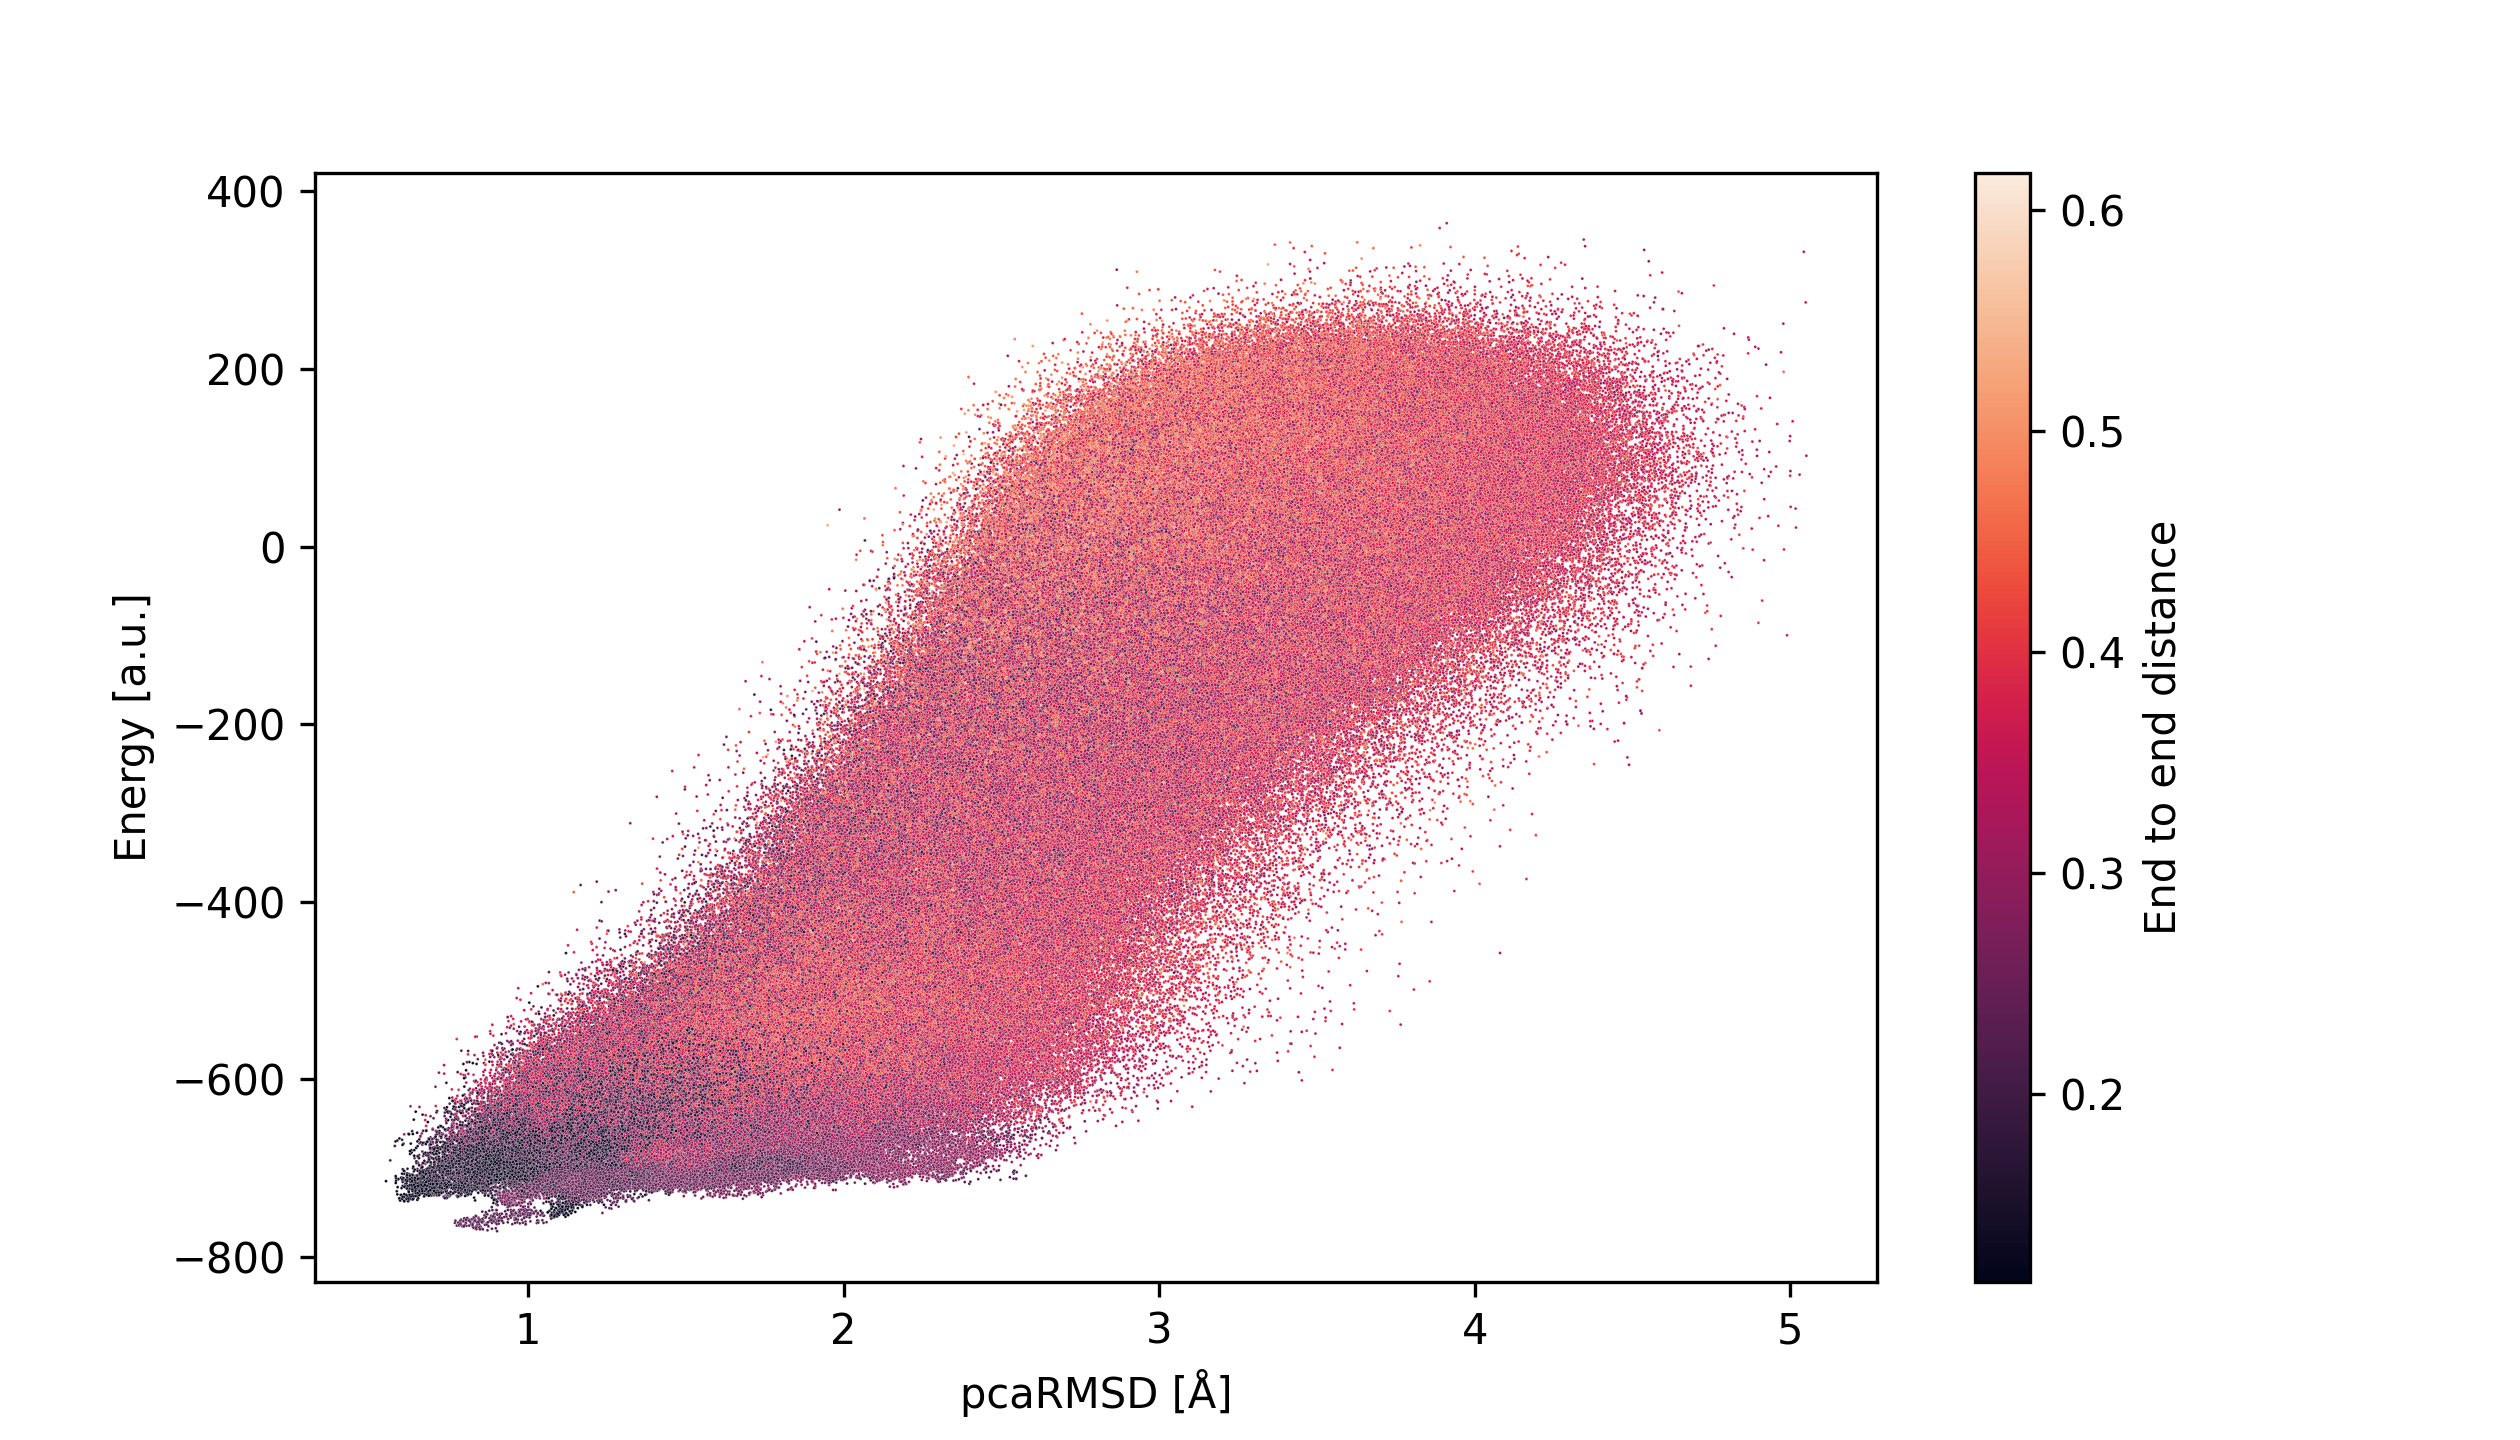
CABS energy values plotted against pcaRMSD values, illustrating how translational symmetry relates to energy across all models from the coarse-grained docking trajectory.
Aggregate model:
Choose a model using buttons below:
RMSD describes model stability, while pcaRMSD reflects the translational symmetry of interacting peptides (values are averaged over the final 1 ns of the MD simulation).
Normalized values of β-sheet content and interlayer contacts observed during the MD simulation.
Normalized β-sheet content calculated for each residue during the MD simulation.
Root mean square fluctuations calculated for each residue in 5 peptides during the MD simulation