Benchmarking
The server performance was evaluated through test predictions of selected protofilaments for which experimental structures are available in the Protein Data Bank. The benchmark dataset comprises 15 experimentally determined protofilament structures, including both NMR- and cryo-EM–derived models. All structures exhibit an in-register, parallel β-sheet arrangement and are formed by aggregating peptides ranging from 22 to 40 amino acid residues in length.
Below, we report benchmarking results for InRegPep assembler across all analyzed systems. Simulations were performed using default parameters. Predicted aggregate models composed of five identical peptides were superimposed onto the corresponding experimental structures, and prediction accuracy was evaluated using the root-mean-square deviation (RMSD).
For each system, approximately 1,000,000 peptide aggregate models were generated using a coarse-grained representation. Model selection followed a two-stage workflow. In the first stage, 20 candidate structures were selected based on symmetry criteria (guided by the pcaRMSD metric), energy-based scoring, and clustering. Models were then reconstructed to an all-atom representation, subjected to geometry optimization via energy minimization, and further evaluated using molecular dynamics (MD) simulations. In the second stage, the 10 top scoring models were selected based on conformational stability, intermolecular contact analysis, and secondary structure conservation, as assessed from the MD trajectories.
The table below summarizes RMSD values for predicted models relative to their corresponding experimental structures:
- Column 3: lowest RMSD observed across the entire model set.
- Column 4: lowest RMSD among the top 10 best-scoring models.
- Column 5: RMSD of the single best-scoring model.
| N.O. | PDB ID | RMSD [A] | Peptide length | Peptide sequence | ||
|---|---|---|---|---|---|---|
| Best from all | Best from top 10 | Best scored | ||||
| 1 | 8TEQ | 2.81 | 2.84 | 5.00 | 29 | PQQPQQYVIQYSASYSQQTGPQQPQQFQG |
| 2 | 2NNT | 2.74 | 2.97 | 4.59 | 31 | MGATAVSEWTEYKTADGKTFYYNNRTLESTW |
| 3 | 2E8D | 2.52 | 3.36 | 5.12 | 22 | SNFLNCYVSGFHPSDIEVDLLK |
| 4 | 6TI5 | 2.40 | 3.64 | 5.17 | 30 | EVHHQKLVFFAEDVGSNKGAIIGLMVGGVV |
| 5 | 6VPS | 3.01 | 3.71 | 3.77 | 31 | QLHQQQHQQQHQQHQQHQQQQQLHQHQQQLS |
| 6 | 2MPZ | 2.50 | 4.09 | 4.96 | 26 | QKLVFFAENVGSNKGAIIGLMVGGVV |
| 7 | 8EZD | 3.55 | 4.44 | 18.31 | 31 | VHHQKLVFFAEDVGSNKGAIIGLMVGGVVIA |
| 8 | 6ZRQ | 3.67 | 4.62 | 4.62 | 23 | FLVHSGNNFGAILSSTNVGSNTY |
| 9 | 6N37 | 3.73 | 4.84 | 17.90 | 36 | NFGAFSINPAMMAAAQAALQSSWGMMGMLASQQNQS |
| 10 | 8AZ1 | 3.34 | 4.91 | 8.67 | 25 | ANFLVHSGNNFGAILSSTNVGSNTY |
| 11 | 8SEK | 5.04 | 5.41 | 9.22 | 32 | GYEVHHQKLVFFAEDVGSNKGAIIGLMVGGVV |
| 12 | 6UUR | 3.03 | 5.47 | 17.01 | 40 | KTNMKHMAGAAAAGAVVGGLGGYMLGSAMSRPIIHFGSDY |
| 13 | 2LMN | 4.12 | 5.89 | 7.75 | 32 | GYEVHHQKLVFFAEDVGSNKGAIIGLMVGGVV |
| 14 | 8OVM | 4.40 | 7.30 | 16.15 | 36 | RHDSGYEVHHQKLVFFAEDVGSNKGAIIGLMVGGVV |
| 15 | 2BEG | 3.29 | 7.38 | 9.00 | 26 | LVFFAEDVGSNKGAIIGLMVGGVVIA |
The accuracy of the modeling pipeline implemented in the InRegPep server was further validated through test predictions of additional protofilament structures with available experimental data, as reported in two publications [1,2]. A similar computational procedure also proved highly successful in predicting the structure of the insulin protofilament [3].
The insulin molecule has a complex topology, consisting of two peptide chains (A and B) connected by two interchain disulfide bonds. In addition, chain A contains one intrachain disulfide bond [3]. The fibril structure of insulin, representing an in-register parallel polymorph, was recently reported (PDB ID: 8SBD) [4]. The resulting insulin protofilament models, composed of 15 layers of insulin molecules, closely resemble the experimental structure. The RMSD values were 3.05 Å for the best model from the trajectory, 3.65 Å for the best model among the top 10, and 3.91 Å for the single best-scoring model from the entire ensemble of predicted structures (Figure 1) [3].
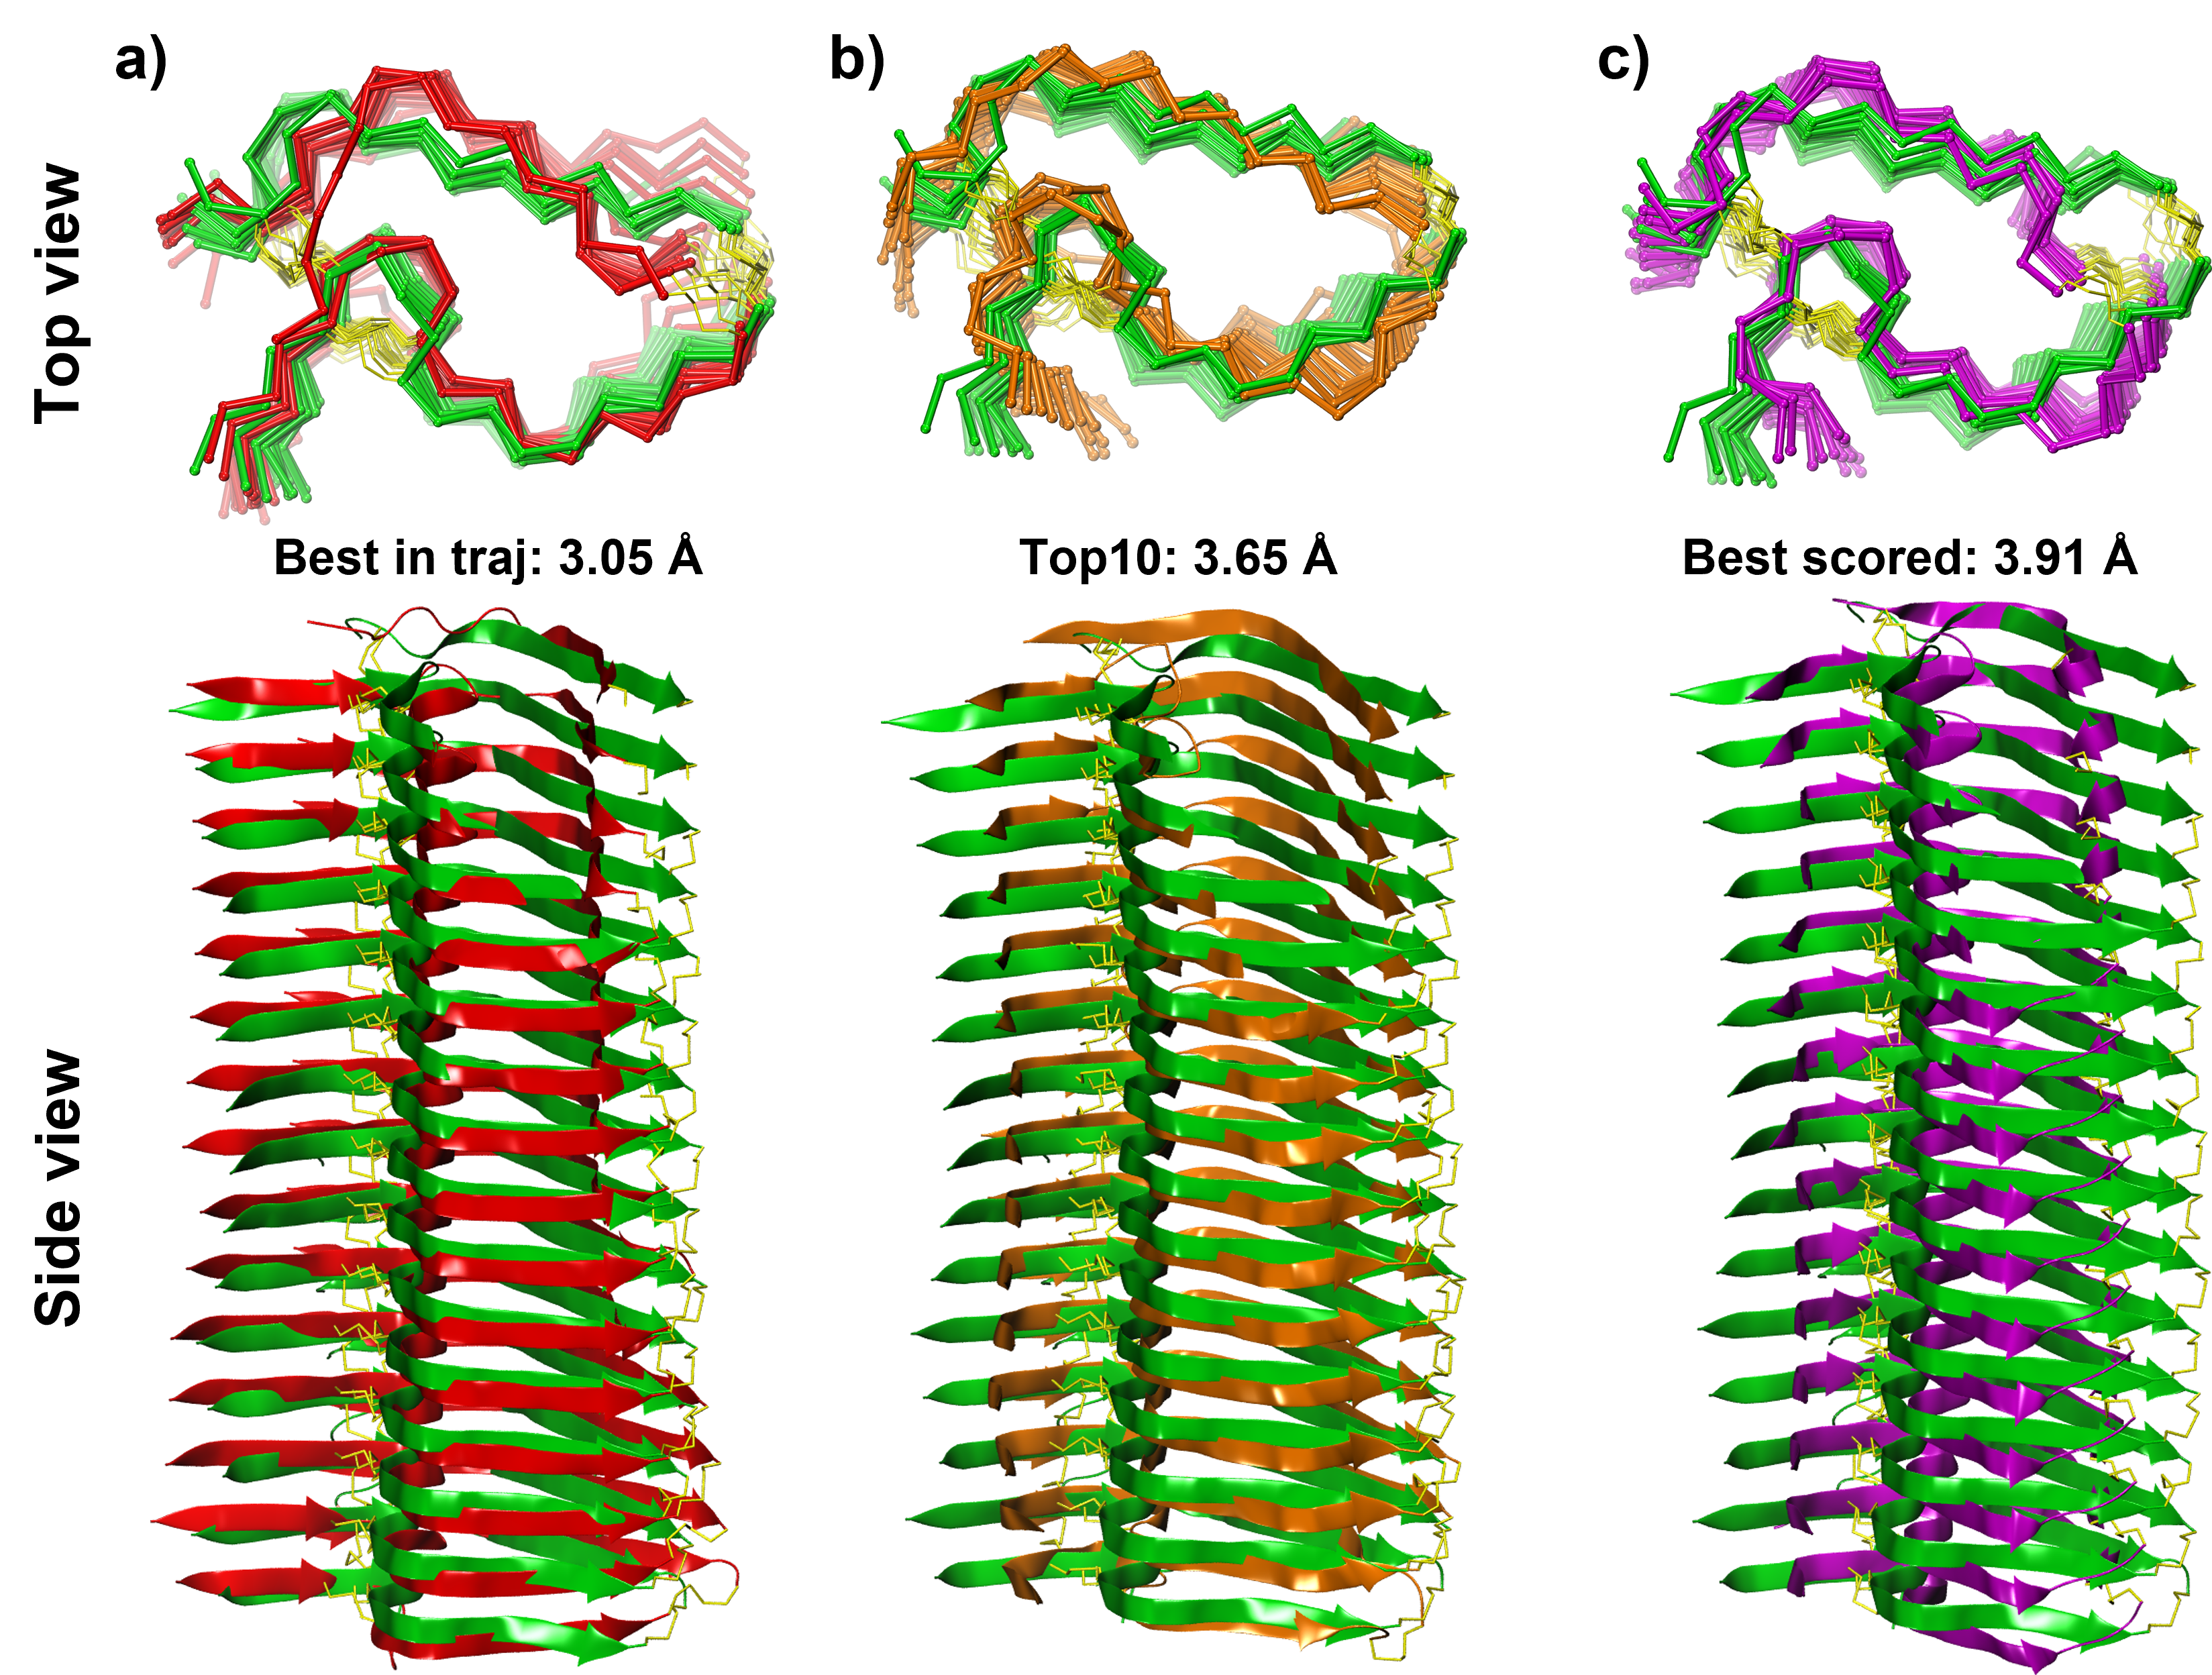
Figure 1. Predicted structures of insulin protofilament models. Views are shown along the protofilament axis (top) and from the side (bottom). Three representative models are presented: the best model from the trajectory (red), the best model among the top 10 (orange), and the overall top-scoring model (magenta). All models are superimposed onto the reference structure (green; PDB ID: 8SBD). Disulfide bonds are shown in yellow. Figure adapted from [3].
References:
- Koliński, M., R. Dec, and W. Dzwolak, Multiscale Modeling of Amyloid Fibrils Formed by Aggregating Peptides Derived from the Amyloidogenic Fragment of the A-Chain of Insulin. International journal of molecular sciences, 2021. 22(22): p. 12325.
- Puławski, W., A. Koliński, and M. Koliński, Integrative modeling of diverse protein-peptide systems using CABS-dock. PLoS Computational Biology, 2023. 19(7): p. e1011275.
- Puławski, W., A. Koliński, and M. Koliński, Multiscale modeling of protofilament structures: A case study on insulin amyloid aggregates. International Journal of Biological Macromolecules, 2025. 285: p. 138382.
- Wang, L., C.E. Hall, E. Uchikawa, D. Chen, E. Choi, X. Zhang, and X.C. Bai, Structural basis of insulin fibrillation. Sci Adv, 2023. 9(37): p. eadi1057.